We are using the journal Ecology as a guide to presenting tables in reports. Here is an example with parts of the table labelled in red:
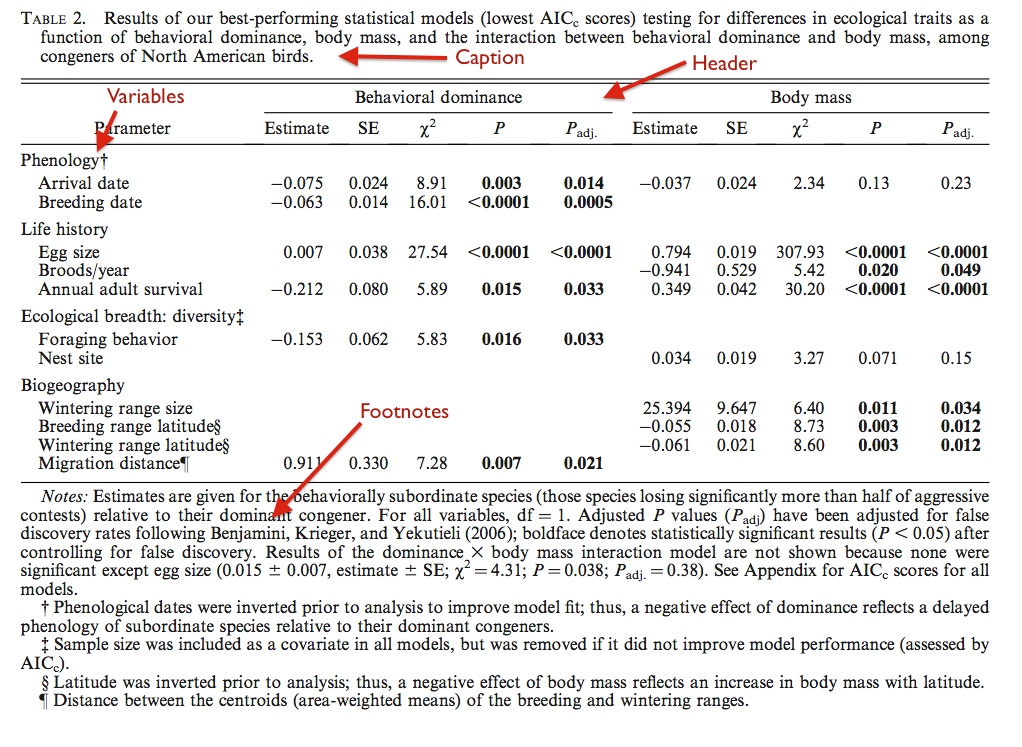
Example Table style
Always use the table function in your word processor to set up a table. Use the following details for formatting:
- Caption: located above the table, informative as to what's in the table. You can add details in the Footnotes
- Header: keep these column titles short but informative, usually only one or two words
- Variable list: make these as informative as possible so that the table can be fully understood without reference to the text. Use Footnotes to explain abbreviations or terms that are not self explanatory. Use subheadings as shown in the table above, if they help to make the table easier to read and understand
- Footnotes: these can be numbered as superscripts, or with symbols. Use the footnotes to explain the details of headers or variables, to point to anomalous results, or specific details that need explaining
- Borders: use only horizontal lines as shown above
- Font: it's OK to use a sans serif font like Helvetica in a table, and sometimes you will need to use a font smaller than 12 point to make it fit on a page